New York Bedrock Valley Results

Laura Sherrod - 2016

Resistivity surveys were performed using an MPT DAS-1 Electrical Resistivity Tomography system in dipole-dipole array and had electrode spacing ranging from 2 to 5 meters.  Combinations of 32 or 64 electrodes were used for each survey.  No clear bedrock boundary was imaged by the resistivity surveys despite close proximity to an observed outcrop (R1).  However, boreholes data which resulted in unexplained discontinuity of clay layers was clearly imaged by the resistivity surveys (R2).  Surveys employing 64 electrodes resulted in very deep imaging of the subsurface, illustrating the heterogeneity of the glacial deposits (R11).

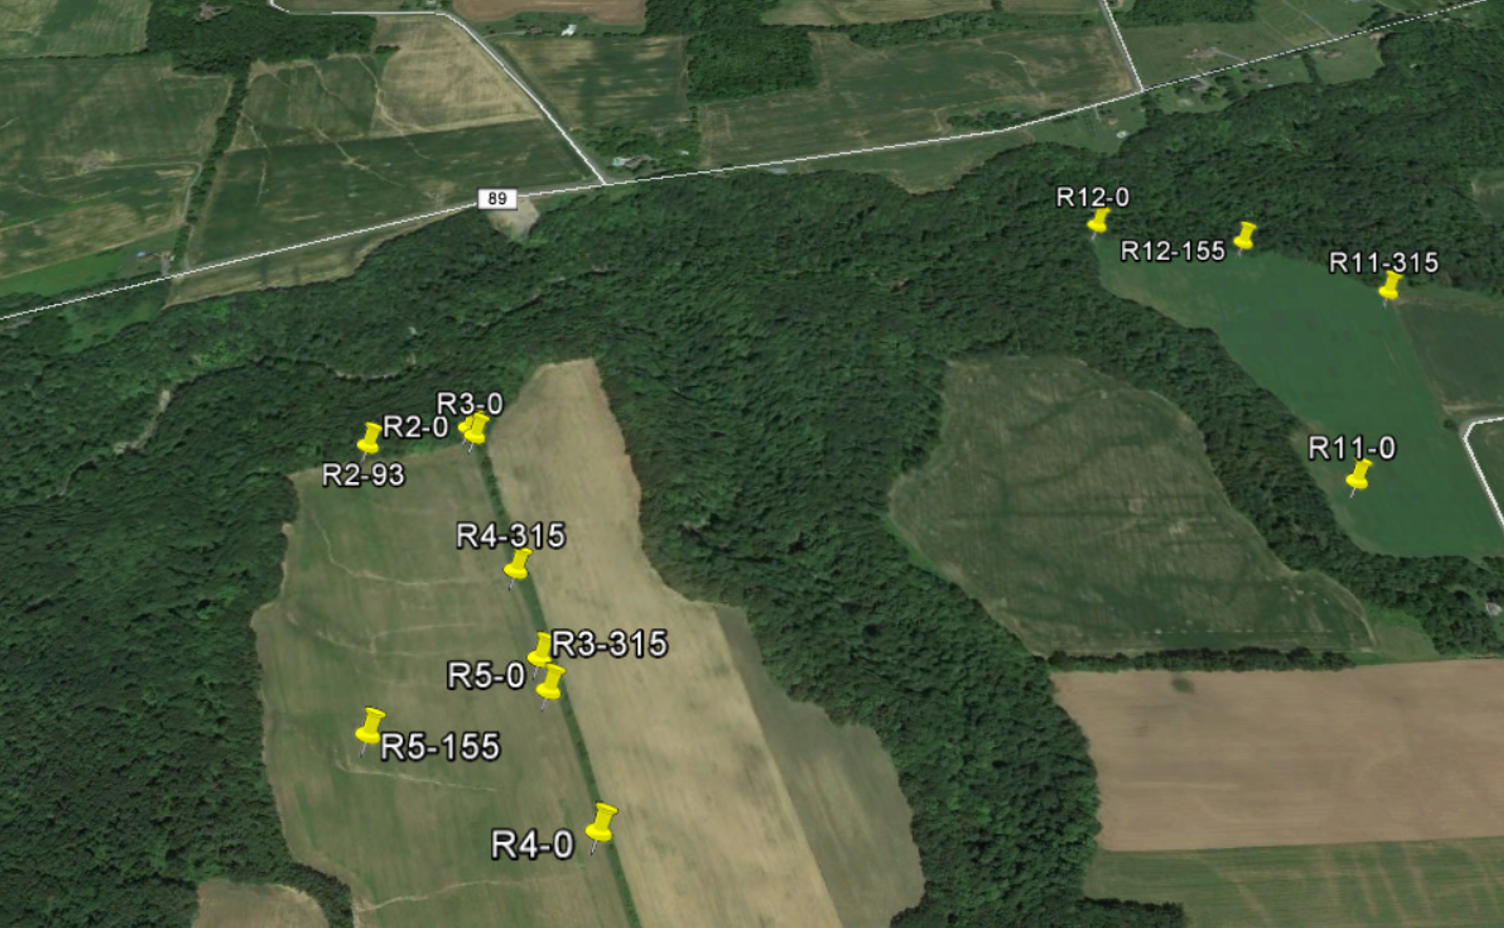
Map of the survey area with endpoints of the surveys marked.


Resistivity Survey R1

Resistivity Survey R2

Resistivity Survey R11


Students decend into the ravine.  Dr. Andrew Kozlowski discusses the geology of the area at the base of the ravine Ashley Richardson inspects the sediment in the walls of the ravine. 
David Vales lays the resistivity cable Dr. Andrew Kozlowski points out soft sediment deformation features Close up view of the soft sediment deformation feature
   
Bojan Milinic and Austin Keller set up the resistivity line David Vales and Austin Keller in the foreground set up the resistivity line MPT DAS-1 sheltered from the afternoon rain by a KU umbrella 
David Vales and Ashley Richardson untangle the cable Students climb out of the ravine Break time at the farm
2016 New York Glacial Surveys
Hops Farm Results
Geologic Mapping Resistivity
Sherrod Home Page GSKU