|
The
largest landslide in New York State history
began in early May 2011. Melting of
heavy winter snowpack followed with
abnormally high amounts of April rain
saturated the subsurface glacial
stratigraphy and initiated the 82-acre slide
landslide on Porter Mountain in the
High-Peaks region of the Adirondack
Mountains.
Downslope
soil movement rates between 15 and 60 cm per
day have shown their destructive capacity as
the shifting soils have caused one house to
be condemned due to the unstable ground
under the foundation. At the same time,
three other houses were in immediate danger.
Dr. Andrew Kozlowski
and
Dr. Brian Bird of
the New York State Geologic Mapping Program,
invited a group from Kutztown University
(Dr. Laura Sherrod and two undergraduate
researchers - Kenneth Schlosser and Jarred
Swiontek) to participate in the examination
of this landslide.
Geophysical methods were employed to map the
glacial deposits in three dimensions to
better understand the mechanisms driving
this landslide.
|
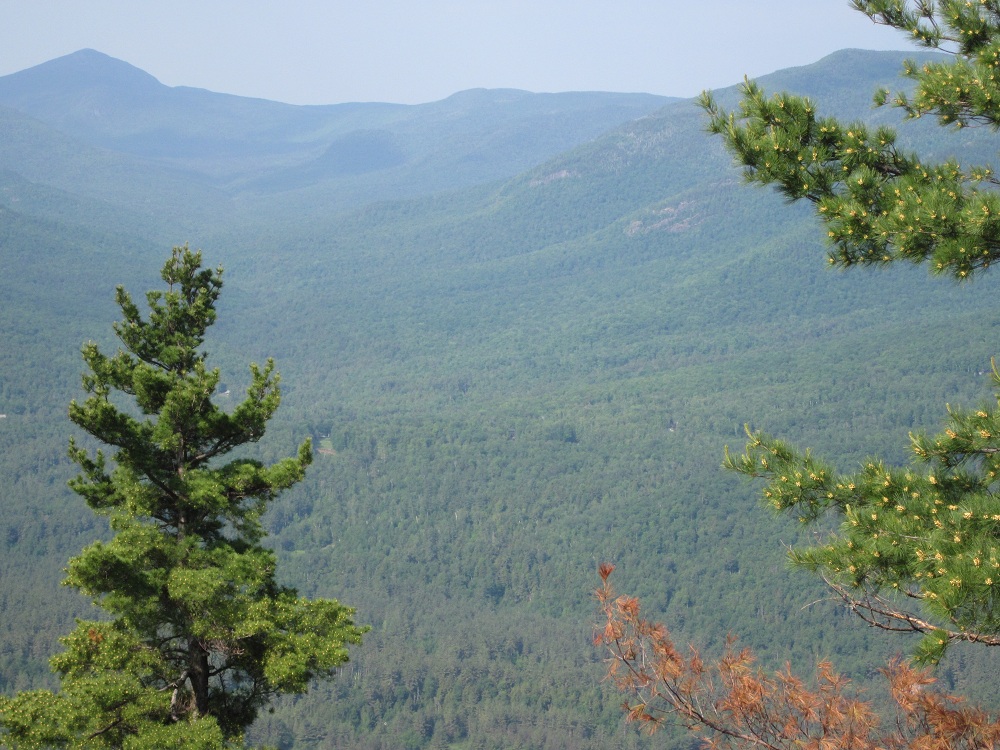 View of the landslide
from across the valley - note the small
scarp to the right of the pine tree at the
left
|
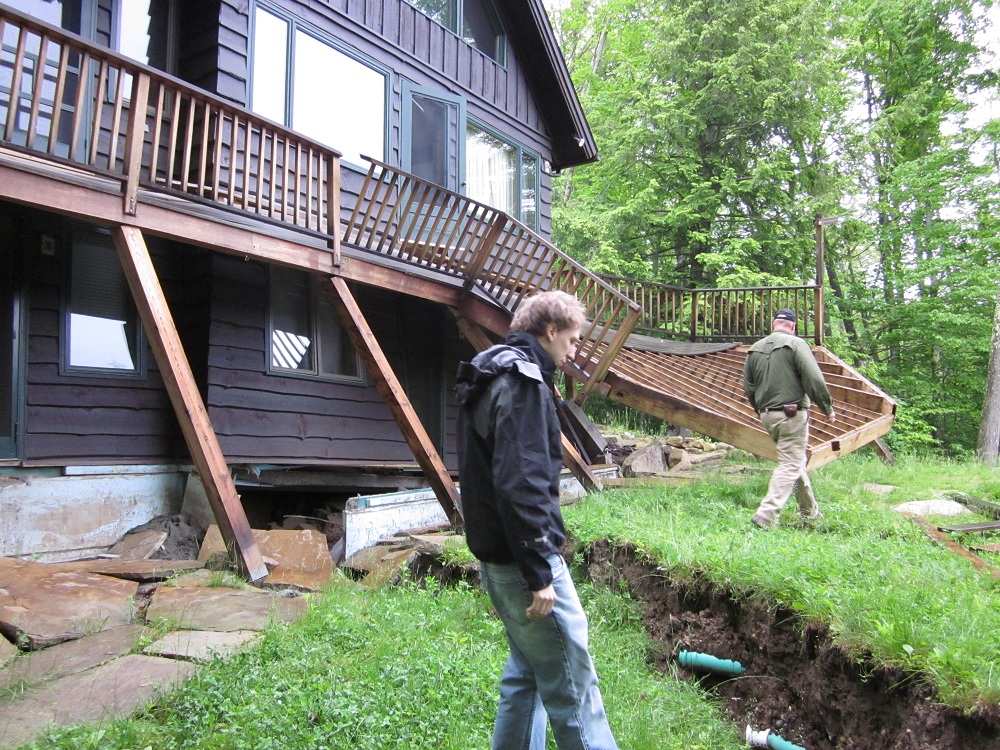 Condemned house with
foundation on the developing scarp with
Jarred Swiontek (left) and Brian Bird
(right).
|
The bedrock in this area is believed to be
anorthosite which underlies a surficial
lithology of glacial sediments. Depth to the
bedrock was measured at 76 m in a borehole
at the base of the slide. However, in a well
near the top of the slide, depth to bedrock
was measured at 6 m, with some exposures of
bedrock visible at the surface. Several
homeowners are considering moving their
homes from their current foundations to
alternate foundations. The topography of
the bedrock is particularly important for
such an expensive move.
|
To delineate three-dimensional trends of the
bedrock in the subsurface, several of the
geophysical surveys followed the surface
exposures of bedrock to a depth where these
features were no longer detectable. Nineteen
resistivity surveys were implemented to map
the subsurface glacial features and depth to
bedrock using a MPT DAS-1 Electrical
Impedance Tomography System. GPR profiles,
using a SIR 3000 GSSI radar system with
100MHz antennae, were collected along many
of the resistivity lines and through
reconnaissance lines in several other
locations (e.g. along roads). Surveys
identified features such as the surface of
the bedrock, clay and sand layers, and depth
to the water table.
|
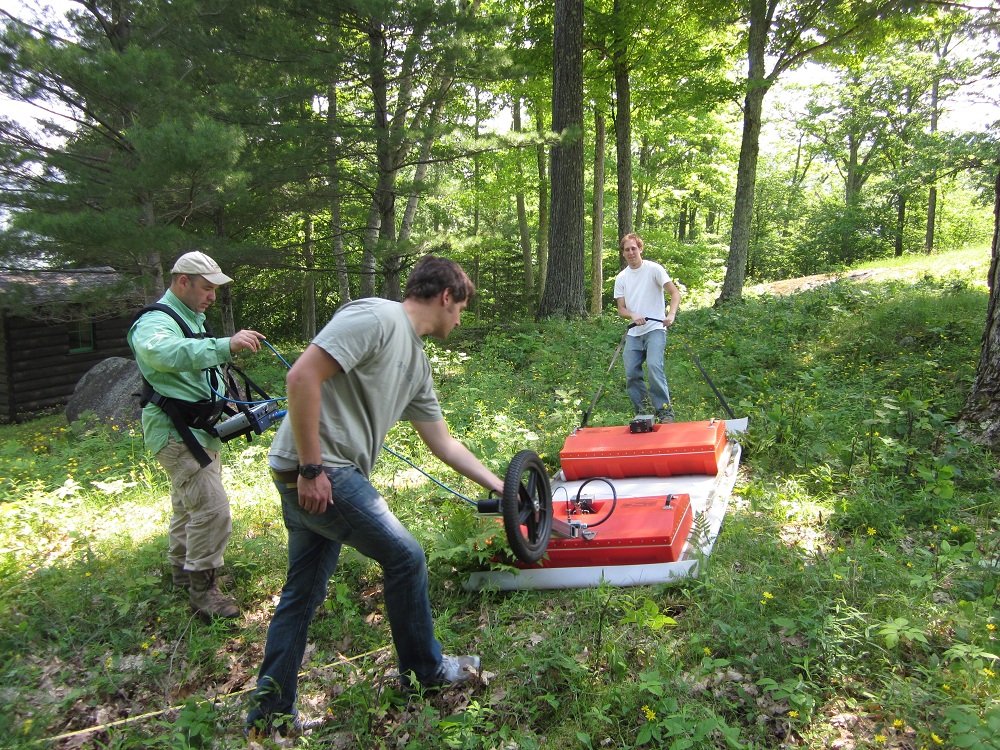
GPR survey with Andrew
Kozlowski (left), Kenneth Schlosser
(center), and Jarred Swiontek (right) |
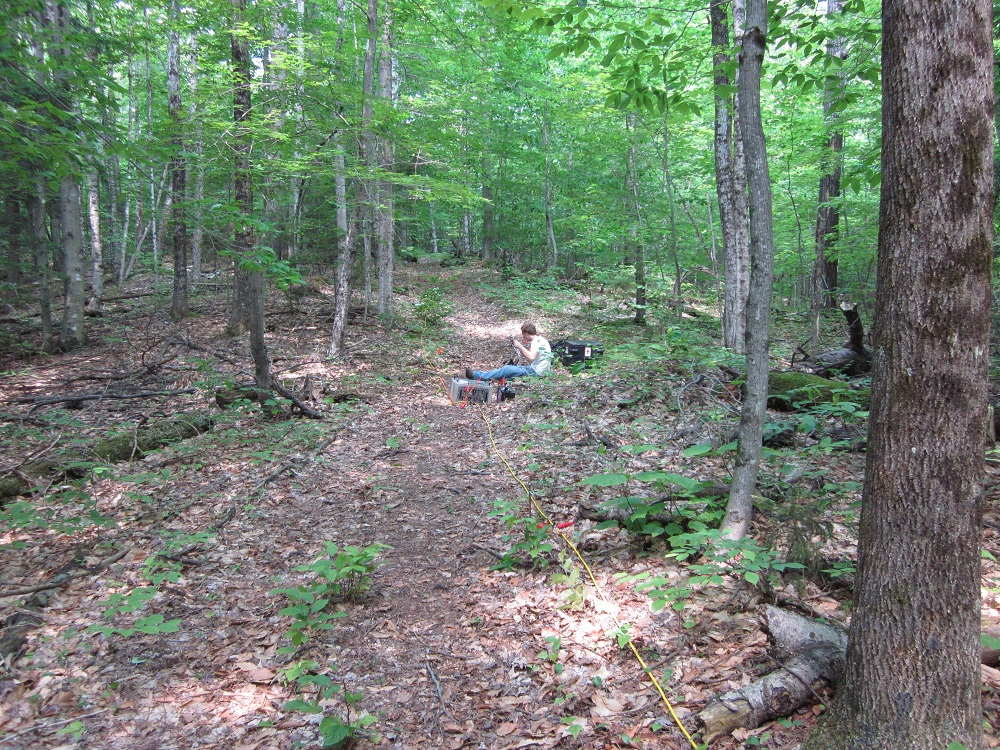 Resistivity survey line
with Jarred Swiontek.
|
The results of the
geophysical surveys are currently being
analyzed to develop a three-dimensional
image of the subsurface glacial stratigraphy.
Preliminary analysis indicates that there is
good correlation between the data sets (well
borings, GPR, and resistivity). Additional
geophysical data from seismic surveys and
geophysical well logs will be incorporated
into the final analysis. More to come as
results are analyzed . . .
|