West Creek 2014 Results

Laura Sherrod - 2014

Five temperature probes were installed to record temperature profiles (right) at locations of resistivity anomalies (locations shown below). 

The Matlab program VFLUX was used to process the data and calculate the downward flux at each of these locations, with zones of high resistivity corresponding to high values downward flux and zones of high resistivity corresponding to moderate values of downward flux or upward flux of water through the streambed. 


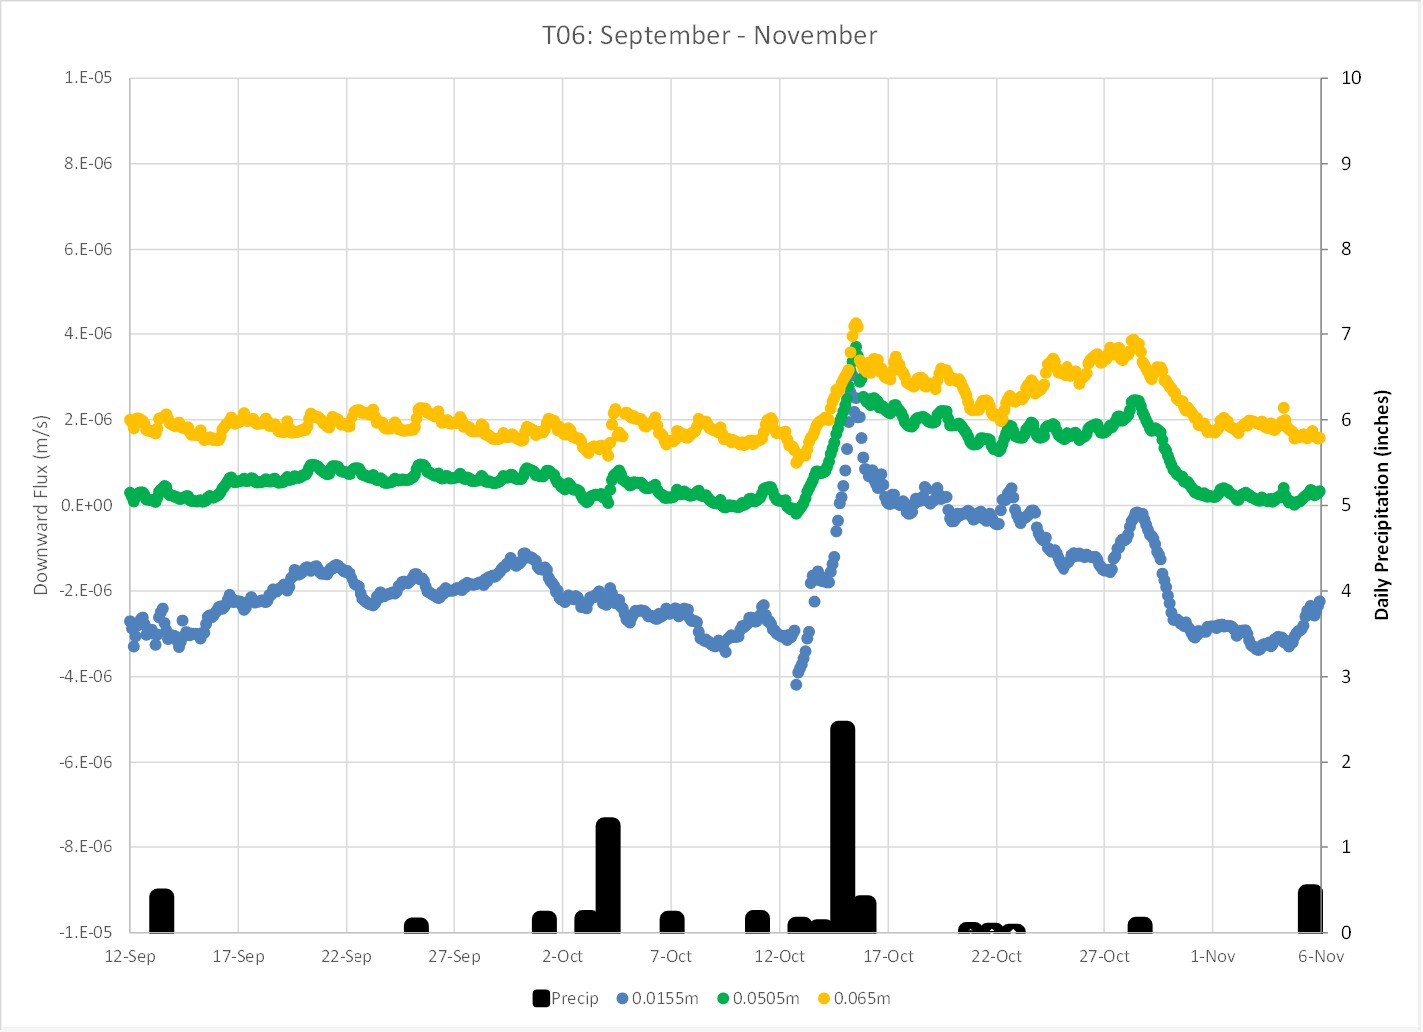
Temperature flux results at the location of probe 6 (corresponding resistivity profile shown below)


Resistivity profile showing locations of potential seepage
 
Temperature flux results September through November (low flow)


Temperature flux results November through January (moderate flow)
Alex Spielman and Sebastien Treciak set up the resistivity survey Alexandra Racosky and Emily Snyder perform stream discharge measurements Lunch break at the Foresetville park by West Creek
Sebastien Treciak performs stream discharge measurements Alex Spielman carries the electrodes along the resistivity survey line Sebastien Treciak and a salamander
West Creek 2014 Environmental Geophysics and Hydrogeology Resistivity
Sherrod Home Page