Use of Debuggers


A Brief Introduction to GDB, including its use within emacs


Prepared by Professor Daniel Spiegel

Kutztown University


A debugger is a program that is used to run other programs. In a debugger, a program may be executed, debugged, or a combination of both. Further, debuggers provide commands in order that data may be examined.


There are many operations available in most debuggers. This document will only cover a subset of the functionality of debuggers. The gdb debugger available to Kutztown students will be described.


You can find a detailed (and long) description of this debugger online:

GNU project gdb:      http://www.gnu.org/manual/gdb-5.1.1/html_mono/gdb.html


The gnu gdb documentation site page has a link to a detailed manual for its use within emacs (gdb in emacs is covered shortly).


Features of Debuggers:

¨      Check the order of statement execution in a program.

¨      Evaluate a variable, parameter, or (possibly) an expression at a particular point during program execution.

¨      Determine where execution was occurring in a program when a program crashes, even if the crash was in a library.

¨      Stop a program’s execution at a particular statement


Debugger Operations:

The following are basic operations of all debuggers:


Setting a Breakpoint

This operation is used to cause a program that is executing in the debugger to suspend itself, permitting debugging. In many integrated development environments (IDEs), a program can also be suspended and enter debugging mode via a command. Visual C++ allows this via a break command that suspends immediately and also by a run to cursor command that stops the program on the line the cursor is on.


Resume Execution

This operation restarts a program that is in debugging mode. The program will execute until it terminates, or encounters a breakpoint or other suspend directive.


Execute a statement

¨      Step over – Execute the present statement. If the statement is a function call, the function will be executed; the debugger will stop at the statement after the function call.

¨      Step into – Execute the present statement. If the statement is a function call, the function will be debugged; the debugger will stop at the first statement inside the function. Note that if you perform a step into on a library function call such as cout <<, the debugger may attempt to step into the file containing the library function. In Visual C++, this will load a file, usually full of assembly language statements; in gdb, you may have trouble, even if you use finish to get out. Use of step into with function calls should be limited to functions you wrote.


Note: Step into and Step over are indistinguishable if the present statement is not a function call.


¨      Step out – This operation resumes execution until the function the program is executing terminates; the debugger will stop at the statement after the function call. This function is available in both Visual C++ and gdb.


Watching Variables

At any time during a debugging session, you may examine the value of a variable via a watch. In IDEs, watches can be set up in a window. In gdb, the value of a variable and/or expression can be output.


Enabling and Starting GDB:

To enable gdb to be able to display the statements of your program, you must use the –g flag during compilation and linking of all files comprising your program. The –g flag causes the compiler and linker to maintain variable names and untranslated C++ statements, in order that variables can be examined and C++ statements can be displayed and followed.


To start a stand-alone gdb session, simply type gdb <executable> at the system prompt. For example, to debug a.out, issue the command


Unix Prompt >gdb a.out


gdb will start and load a.out.


Alternatively, gdb can be started by simply issuing the command gdb at the Unix prompt. To then load an executable, issue a file command. For example:


(gdb)file a.out


To start a gdb debugging session in emacs:


¨      Start emacs without specifying a file

o       Unix Prompt >emacs

¨      Issue the command to execute a program on the emacs command line

o       ESC-x  (then hit return)

¨      Start gdb

o       gdb (it will follow the M-x, which remains on the emacs command line)

¨      You will then be prompted by the phrase run like this? Add the file to debug (or use the file command after gdb starts)


The gdb environment will appear inside the single emacs window.


GDB commands:

When GDB starts, the loaded executable is not running; there are many commands that can be issued to prepare debugging. A glossary of commands can be displayed by issuing the command


(gdb)help


There will be a list of command areas, each of which has its own help list. For example,


(gdb)help running


will list commands available for running a program. If you issue a help command followed by and actual command, the help information for that command will be displayed.


Commands can often be issued without typing the entire command. Here are some commonly used commands; many of them can be invoked using only the first letter:

 (gdb) quit – exit the debugger

 (gdb) file – load an executable file

 (gdb) break line-number/function name -- Set a break-point on a line/at start of function

 (gdb) run <args> -- start running the program; if there are command-line arguments, put them after the run invocation

 (gdb) cont -- continue running, after a break

 (gdb) next -- Next program line (step over function calls)

 (gdb) step -- Step into function calls.

 (gdb) finish - Step out of the present function

 (gdb) print expression -- Show value of a variable or expression

 (gdb) list – List 10 lines of the program being debugged. The sixth line is the preset statement. Subsequent, consecutive entry of list will list the next 10 lines.

 (gdb) where – obtain a backtrace showing all function calls before the current statement

 (gdb) up – Move to the function that called the present function. Useful if your program crashes in a library function; use up to get to the last function call in your program

 (gdb) down – Reverses the action of up

 (gdb) delete – Removes breakpoint by number (see example following). If no number, all deleted.

 (gdb) kill – Terminates the program.


Notes on selected gdb commands:

Break: To set a breakpoint on a line, issue the break command with a line number. For example, to set a breakpoint on line 43, issue b 43  . To set a breakpoint at the start of a function, issue the break command with the function name. For example, to suspend execution and enter debugging mode at the start of function foo, issue b foo  . To debug from the start of the program, issue b main

            In projects with multiple files, a breakpoint can be set in an associated file using <file name>:line number

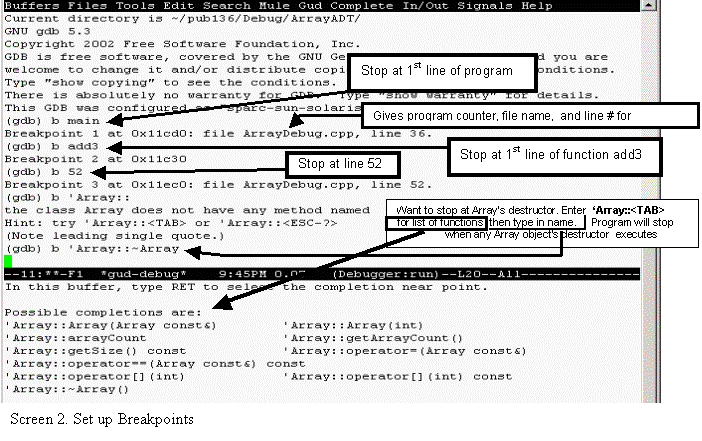
            A breakpoint can be set at the beginning of an object’s function using <class>::<function>


            Note: In IDEs a breakpoint is set explicitly within the program code in a window.


Print:    The print command has great functionality. You can enter just about any valid expression, and it will be evaluated an printed. You can print the values of pointers, dereference a pointer, and print entire arrays and objects. See the emacs example on the next page for sample uses of the print command.


Debugging in emacs


To debug in emacs, start gdb within emacs as noted earlier. Then, set a breakpoint. Start your program, and when the program reaches the breakpoint, emacs will split into two windows. One window will contain the gdb command environment, and the other will contain the program code, with a text arrow (=>) indicating the present statement.


You may then issue gdb commands in the original emacs window while viewing the present line and surrounding code in the 2nd window.


To exit emacs, enter ctl-x followed by ctl-c. If a program is loaded at the time, you may be prompted before exiting.


Demonstration of gdb within emacs:

Debugging using gdb within emacs will be demonstrated using the ArrayADT example from class. This example uses the files Array.h, Array.cpp, and ArrayDebug.cpp. Also, on a Unix system such as acad.kutztown.edu, you would want to obtain the file makefile, which establishes compilation rules for this program. These files are available on acad in subdirectory /export/home/public/spiegel/cis136/Debug/ArrayADT . On the web, they are available at URL http://faculty.kutztown.edu/spiegel/Debugging/Files/. For more information on makefiles, see the makefile primer at http://faculty.kutztown.edu/spiegel/Makefile/Makefile.htm.


Text Box: // File: ArrayDebug.cpp
// Driver for Array ADT. 
// Debugging Demo - show how r-value is created, and some examples
//	to distinguish r-values and l-values, along with constructor use
//	in the debugger

#include <iostream>
#include "Array.h"

// Change argument to & to see change in debugging
int doubleVal(int a)
{	return(a*2);
}

// Why can Array one be passed here? 
void add1(Array a)
{for (int i=0;i<a.getSize();i++)
	a[i]=a[i]+1;
}

// Passing the object by reference. Can only pass changeable Array
void add2(Array &a)
{for (int i=0;i<a.getSize();i++)
	a[i]=a[i]+2;
}

// Try exchanging headers. Why doesn't it compile? Hard!
Array add3(Array a)
// Array add3(const Array &a)
{for (int i=0;i<a.getSize();i++)   // breakpoint 2
	a[i]=a[i]+3;
 return(a);
}

int main()
{Array const one(3);	// breakpoint 1
 int n;
 n=one[0]+one[1];
 if (10<2*one[1]-5)
	 cout << one[2];
 cout << "One:" << one;
 Array two=one;
 two[1]=doubleVal(two[2]);
 two[0]=43;
 two[2]=56;
 cout << "Two:" << two;
 Array three;
 three=two;
 add1(one);
 cout << "One:" << one;
 // add2(one);
 add2(two); 	// breakpoint 3
 cout << "Two:" << two;
 // Next line changes values in one in the function. Why is this OK?
 three=add3(one);
 cout << "Three:" << three;
 return(0);
}

One:               0           0           0
Two:              43           0          56
One:               0           0           0
Two:              45           2          58
Three:             2           2           2

Figure 1. Demo Program ArrayDebug.cpp

The contents of ArrayDebug.cpp are in the box at  left, along with the output obtained from its execution. This file includes breakpoint comments that aren’t in the actual file. There are a number of functions. main() is declared last, mainly to save room by eliminating the function prototypes.


These functions provide a variety of argument types/return values to permit demonstration of debugger and language features.


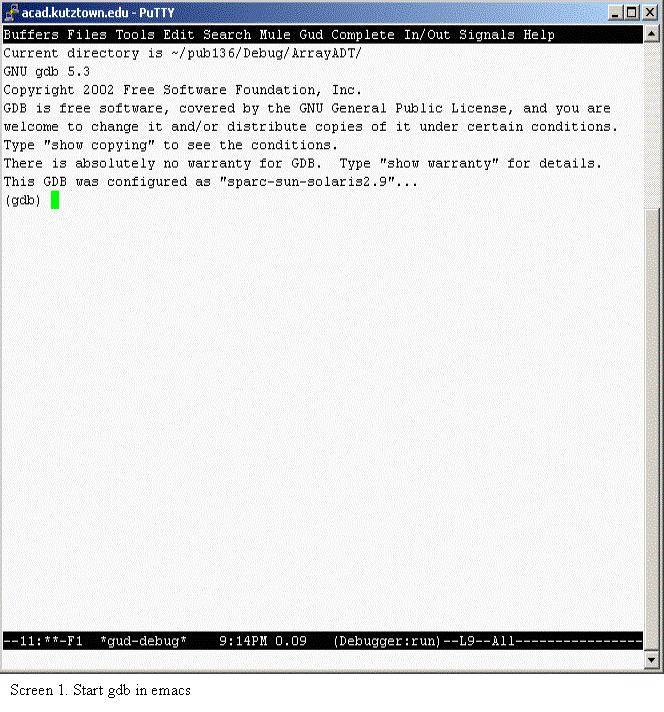
To begin, make sure that compilation occurred with the –g flag (if compiling with g++). The makefile handles this (Do you know what a makefile is/does? If not, be sure to read the makefile primer on this site). Now, start the debugger inside emacs as shown previously. The name of the executable produced by the makefile is debug. This demo will use the putty telnet client, in which will encounter the screen seen below (using putty is not required...


Screen 1 was obtained by starting emacs, hitting ESC, then X, then gdb, and return. When prompted Run like this? type debug (or whatever name your executable has) and hit return again.


To prepare to run the program, first set up some breakpoints. The lines in bold in the program in Figure 1 will be breakpoints. To set them up, the following commands are issued:


OK, now the program can be started. Use the run command to start (need only enter r as on top of window).


The program stops at the first breakpoint, the first line of main() in Screen 3. At this point, nothing is defined, as we haven’t yet completed the first executable statement. 

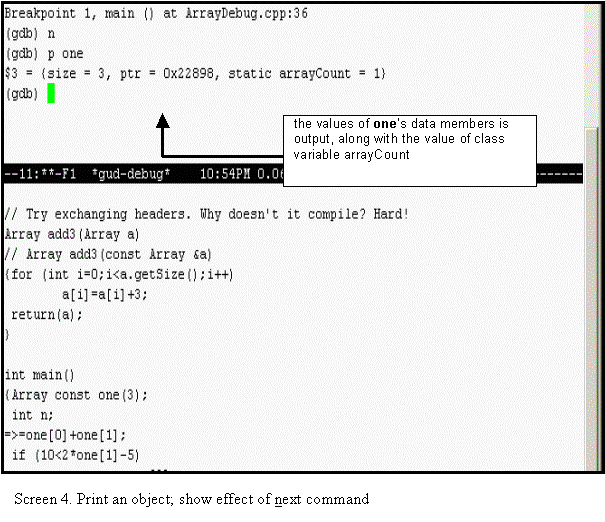
Issue the next command (Screen 4) to construct the Array object named one. Note that the location arrow skips over the declaration of integer n, since that statement is not executable (wait! what makes the declaration of one executable?). Following this, issue the print command (p one) to see the value of that object. Note that the value of data member ptr is a memory address (the 0x prefix means the value is in hexadecimal form, or base 16). The value of class variable arrayCount is printed, it is a data member of the class (and thus all its objects). Now, enter the continue command to restart the program; it will stop at the next breakpoint.


The program executes the first two output statements in main(), and the output of Arrays one and two is printed (Screen 5a). The values can be easily confirmed by briefly inspecting ArrayDebug.cpp in concert with knowledge that an Array object is constructed with all elements equal to 0.

But, the program doesn’t stop where you might expect. It actually stops in a different file! While previous action all occurred in ArrayDebug.cpp, the next breakpoint reached is a call of the destructor.


It is certainly of interest to determine how this came to be. We know that the program hasn’t yet reached breakpoint 3, so some object left scope before that point. To find out where, use the up command.


The program is now executing in ArrayDebug.cpp, at the call of add1(one).  If you look at the declaration of this function, you can see its argument is not a reference argument. This is the cause of the destructor call. A value argument that is an object must be copied from the actual argument, and this means the copy constructor must be executed (this will be demonstrated shortly). When the function returns, this copy leaves scope and must be destroyed. To explore this further, we will use some stepping during the later execution of add3(), which also has a value argument.


Again, issue the continue command to restart the program. It will stop when it reaches the next breakpoint. The program will stop at the call of add2 in main() (bottom of the visible window in Screen 6). Let’s step into the function so we can see something else. But first, print  the actual argument and its address (p two and p &two) , then issue the step command to debug the function (issuing next  would have executed it, rather than entering it and stopping at the first line),  and print the formal argument’s address (p &a) after entering the function. Finally, print the actual argument from inside the function, using scope resolution by issuing the command p &(main::two). You can see that the formal and actual argument have the same memory address, as would be expected.


This leaves us at the first line of the function, as shown at left in Screen 6. Let’s examine the alteration of the second of the elements of Array a (index 1).


We must wait for i to be 1. To get there, (Screen 7) first issue the next command to step over (execute, not debug) the call of getSize() in the for statement. Now, make i display each time by issuing display i. Now, issue the next command until i displays as 1 and the body of the for loop is to be executed (location indicator is on the assignment to a[i] in the body of the loop). Now, print a[i]. To do this, you must print the proper data member. Issue p a.ptr[i]. To prepare to see the effect, print main::two.ptr[i],


Now, issue next, then repeat the previous two prints.


Issue the continue command until the program terminates. Remove all breakpoints by issuing the command d (this deletes all breakpoints; you will be prompted).  Type undisplay to reverse the effect of any display commands.


Let’s see where the copy constructor gets called. Issue the command to break at a call of the copy constructor by typing b 'Array::Array(Ar and then pressing the TAB key. gdb will auto-complete the command for you; just press return. Now, run the program using the r command. For variety, you could have instead issued: b Array.cpp:30, which will stop the program at line 30 of that file (first line of the copy constructor); run the program again.


Your program will suspend with the arrow indicating the open curly brace ( { ) on line 29 of Array.cpp (not shown), inside the copy constructor. To determine what event caused this call to the copy constructor to occur, issue the command up.


Screen 8. Call of copy constructor before add1() executes

 
The call that caused this is the assignment of Array two to Array one. This is due to the return statement in the assignment (=) operator in Array, and is a bit complicated. Let’s look at a more straight-forward call of the copy constructor.


Issue the c command to continue execution. Your program should again stop at line 29 of Array.cpp. Now, issue the up command. The location arrow indicates the call of add1() as shown in Screen 8. The formal parameter of add1() is passed by value (why would it be a compiler error if it was pass by reference?) . We know this means that the actual parameter is evaluated and copied to the corresponding formal parameter. How is an object copied? Using the copy constructor!

Let’s confirm this. Issue the down command. This puts you back into the copy constructor. Let’s see what’s being copied. Issue the command p &init. This will produce a hexidecimal number (it can contain letters between a and f, which are hexidecimal digits). This is the memory address of the object being copied.


Now, issue the command p this. This produces another hexidecimal number, which is the memory address of the object being constructed. Next, issue the command p &(main::one). This produces the memory address of object one. Which value does it match? It should match the memory location of parameter init.


If our theory is correct, the memory location of this should match the formal parameter of the called function add1(). Let’s confirm this. Issue the s command until the copy constructor completes (12 times). The location indicator should now be on line 17 of ArrayDebug.cpp, the first line of add1(). Issue the command p &a. Its memory location is the same as that of this, the self-reference of the just constructed object, and that proves that in order to pass an object by value, it must be copied, requiring use of the copy constructor.


For further exploration of language features, there is a debugger exercise located in URL: http://faculty.kutztown.edu/spiegel/Debugging/Exercise/


Detecting the Location of Unix run-time errors


Text Box: // File: Crash.cpp
// Example of program that crashes for debugger
// Can also demonstrate scope, again in debugger

int b(int i)
{return(i/0);  // divide by 0 on purpose
}

void a(int i)
{int quo=b(i*5);
}

int main()
{int i=25;
 a(i*5);
}
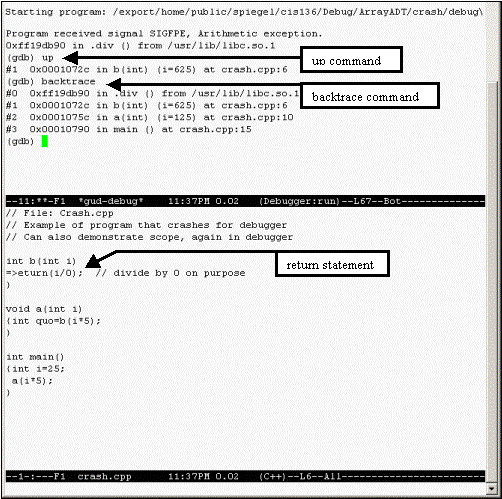
The gnu debugger may also be utilized to determine the exact location in a program where a segmentation fault, bus error, or other fatal run-time error has occurred. When a program crashes due to an unspecified error, start gdb inside emacs, loading the executable (don’t forget to be sure the program is compiled using the –g option). Then, simply run the program and it will report the error. At this point, the emacs window will not have split. To find the statement that caused the error, issue the up command repeatedly until the window splits, revealing the last statement executed.


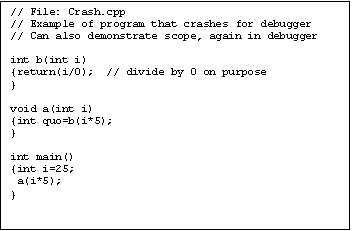
To provide a simple demonstration, there is a file crash.cpp (along with a makefile) on acad, in the subdirectory /export/home/public/spiegel/cis136/Debug/ArrayADT/crash . On the web, the files are available at URL http://faculty.kutztown.edu/spiegel/cis136/Debug/crash/ . This program crashes on a division by zero. The program appears in the box.


Clearly, the program will crash inside function b().To try this out, build the executable (again named debug), start gdb in emacs, and issue the run command. When the program crashes, issue the up command to see the cause. Note that it is often necessary to issue the up command multiple times before the window splits and shows the last line executed in your program. Most run-time errors occur in library functions called by other library functions, which are in turn called from your program.


In the example at left, the executable debug was started. It crashed upon attempting to execute the division by 0 in the return statement where the location indicator is pointing. This line was displayed following the issuance of the up command in the gdb window.


You can also obtain the trail of function calls leading up to a fatal error using the backtrace command. This displays all function calls that occurred prior to execution of the line that (often indirectly) caused the fatal error. Note that the indicated lines can be examined by issuing the up command. For example, to see the call in main() that led to the run-time error, you would issue the up command two more times (after the first issuance of up, the location indicator would be on the call of b() inside function a().


For further information on use of gdb, please consult the gnu project’s gdb manual at the URL given previously.