Streambed Temperature Measurements Results

Laura Sherrod - 2013

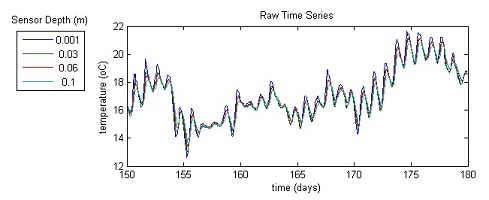
Three temperature probes were installed to record temperature profiles (right) at locations of resistivity anomalies (locations shown below). 

The Matlab program VFLUX was used to process the data and calculate the downward flux at each of these locations, with zones of high resistivity corresponding to high values downward flux and zones of high resistivity corresponding to moderate values of downward flux or upward flux of water through the streambed. 


Temperature profile at location A along the geophysical survey line


Resistivity survey line of the West West Creek showing the location of temperature probe installations. 
 
Calculated flux at location B, primarily downward flux

Calculated flux at location C, both downward and upward flux
 
Dea Musa installs a temperature probe in West Creek. Leanne Hillegas takes discharge measurements with Dr. Levine and Dr. Cravotta. Sara Guisse takes water quality measurements using a YSI 556. 
Streambed Temperature Measurements Environmental Geophysics and Hydrogeology Resistivity
Sherrod Home Page