
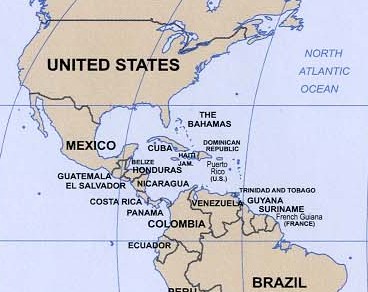
Part of the Western Hemisphere including Cuba and Colombia (same scale as above):
Anchoring and Adjustment
Method
Condition 1: The area of China is 9,396,960 square kilometers.
Condition 2: The area of Cuba is 110,860 square kilometers.
Part of the Eastern Hemisphere including China:
Part of the Western Hemisphere including Cuba and Colombia (same scale as
above):
What do you think the area of Colombia is?
.
.
.
.
.
.
.
Results
The actual area of Colombia
is 1,141,748 square kilometers.

Estimates when the anchor was...

China:     Cuba:
  2900000    980900
   200000    400000
    50000    197000
  2500000    118975
  3132320    567000
     6000    110860
  3000000    175000
  5427312    910999
  2500000    776020
  4000000    330680
  2349240
   800000
  5000000
|
TWO-SAMPLE T TESTS FOR ESTIMATE BY ANCHOR

                          SAMPLE
  ANCHOR         MEAN      SIZE
----------   ----------   ------
China        2,450,000      13
Cuba           456,743      10

NULL HYPOTHESIS: DIFFERENCE = 0
ALTERNATIVE HYP: DIFFERENCE > 0

ASSUMPTION             T       DF        P
-----------------   ------   ------   ------
UNEQUAL VARIANCES     3.94     13.1   0.0008
|
Conclusions
When people make a quantitative estimate under uncertainty, they look for some quantity that they think is related and use it to help them make their estimate. They decide whether they should make an estimate greater or lesser than the related quantity, and then adjust it up or down accordingly in order to get their estimate. However, the related quantity acts as an anchor. In other words, they find it hard to adjust too far up or down, as if the anchor were holding them back. Therefore, if the anchor they start with is higher than what they think their estimate should be, they find it hard to adjust down far enough. If the anchor is lower, they find it hard to adjust up far enough. The result is that the average estimate made from a high anchor will be higher than the average estimate made from a lower anchor.