>Warning.  Command name: GET DATA
>(2103) The variable name (truncated to 64 bytes) conflicts with a
>previously defined variable.
>* Variable Name: "Proc"
>* Conflicting Column: 4
>* Duplicate Column: 11
| Output Created | 02-OCT-2007 17:33:45 | |
|---|---|---|
| Comments | ||
| Input | Data | \\Stucluster\shared\Psychology\Ryan Lab Group\2006 - 2007\Loc_glob_live\Results\data\loc_glob_live_192_SSs_10_2_07.sav |
| Filter | <none> | |
| Weight | <none> | |
| Split File | <none> | |
| N of Rows in Working Data File | 192 | |
| Missing Value Handling | Definition of Missing | For each dependent variable in a table, user-defined missing values for the dependent and all grouping variables are treated as missing. |
| Cases Used | Cases used for each table have no missing values in any independent variable, and not all dependent variables have missing values. | |
| Syntax | MEANS TABLES=Accuracy BY pres1_abs2 BY sim1_seq2 BY proc /CELLS MEAN COUNT STDDEV . |
|
| Resources | Elapsed Time | 0:00:00.13 |
| Cases | ||||||
|---|---|---|---|---|---|---|
| Included | Excluded | Total | ||||
| N | Percent | N | Percent | N | Percent | |
| Accuracy * pres1_abs2 * sim1_seq2 * proc | 192 | 100.0% | 0 | .0% | 192 | 100.0% |
| pres1_abs2 | sim1_seq2 | proc | Mean | N | Std. Deviation |
|---|---|---|---|---|---|
| Present | Simultaneous | Local | .71 | 24 | .464 |
| Global | .62 | 24 | .495 | ||
| Total | .67 | 48 | .476 | ||
| Sequential | Local | .25 | 24 | .442 | |
| Global | .71 | 24 | .464 | ||
| Total | .48 | 48 | .505 | ||
| Total | Local | .48 | 48 | .505 | |
| Global | .67 | 48 | .476 | ||
| Total | .57 | 96 | .497 | ||
| Absent | Simultaneous | Local | .59 | 22 | .503 |
| Global | .40 | 20 | .503 | ||
| Total | .50 | 42 | .506 | ||
| Sequential | Local | .46 | 26 | .508 | |
| Global | .54 | 28 | .508 | ||
| Total | .50 | 54 | .505 | ||
| Total | Local | .52 | 48 | .505 | |
| Global | .48 | 48 | .505 | ||
| Total | .50 | 96 | .503 | ||
| Total | Simultaneous | Local | .65 | 46 | .482 |
| Global | .52 | 44 | .505 | ||
| Total | .59 | 90 | .495 | ||
| Sequential | Local | .36 | 50 | .485 | |
| Global | .62 | 52 | .491 | ||
| Total | .49 | 102 | .502 | ||
| Total | Local | .50 | 96 | .503 | |
| Global | .57 | 96 | .497 | ||
| Total | .54 | 192 | .500 |
| Output Created | 02-OCT-2007 17:37:56 | |
|---|---|---|
| Comments | ||
| Input | Data | \\Stucluster\shared\Psychology\Ryan Lab Group\2006 - 2007\Loc_glob_live\Results\data\loc_glob_live_192_SSs_10_2_07.sav |
| Filter | pres1_abs2 = 1 and sim1_seq2=2 (FILTER) | |
| Weight | <none> | |
| Split File | <none> | |
| N of Rows in Working Data File | 48 | |
| Missing Value Handling | Definition of Missing | For each dependent variable in a table, user-defined missing values for the dependent and all grouping variables are treated as missing. |
| Cases Used | Cases used for each table have no missing values in any independent variable, and not all dependent variables have missing values. | |
| Syntax | MEANS TABLES=Accuracy BY proc /CELLS MEAN COUNT STDDEV . |
|
| Resources | Elapsed Time | 0:00:00.04 |
| Cases | ||||||
|---|---|---|---|---|---|---|
| Included | Excluded | Total | ||||
| N | Percent | N | Percent | N | Percent | |
| Accuracy * proc | 48 | 100.0% | 0 | .0% | 48 | 100.0% |
| proc | Mean | N | Std. Deviation |
|---|---|---|---|
| Local | .25 | 24 | .442 |
| Global | .71 | 24 | .464 |
| Total | .48 | 48 | .505 |
| Output Created | 02-OCT-2007 17:45:10 | |
|---|---|---|
| Comments | ||
| Input | Data | \\Stucluster\shared\Psychology\Ryan Lab Group\2006 - 2007\Loc_glob_live\Results\data\loc_glob_live_192_SSs_10_2_07.sav |
| Filter | pres1_abs2 = 1 and sim1_seq2=2 (FILTER) | |
| Weight | <none> | |
| Split File | <none> | |
| N of Rows in Working Data File | 48 | |
| Missing Value Handling | Definition of Missing | User-defined missing values are treated as missing. |
| Cases Used | Statistics for each table are based on all the cases with valid data in the specified range(s) for all variables in each table. | |
| Syntax | CROSSTABS /TABLES=Accuracy BY proc /FORMAT= AVALUE TABLES /STATISTIC=CHISQ /CELLS= COUNT COLUMN /COUNT ROUND CELL . |
|
| Resources | Elapsed Time | 0:00:00.09 |
| Dimensions Requested | 2 | |
| Cells Available | 116508 | |
| Cases | ||||||
|---|---|---|---|---|---|---|
| Valid | Missing | Total | ||||
| N | Percent | N | Percent | N | Percent | |
| Accuracy * proc | 48 | 100.0% | 0 | .0% | 48 | 100.0% |
| proc | Total | ||||
|---|---|---|---|---|---|
| Local | Global | ||||
| Accuracy | 0 | Count | 18 | 7 | 25 |
| % within proc | 75.0% | 29.2% | 52.1% | ||
| 1 | Count | 6 | 17 | 23 | |
| % within proc | 25.0% | 70.8% | 47.9% | ||
| Total | Count | 24 | 24 | 48 | |
| % within proc | 100.0% | 100.0% | 100.0% | ||
| Value | df | Asymp. Sig. (2-sided) | Exact Sig. (2-sided) | Exact Sig. (1-sided) | |
|---|---|---|---|---|---|
| Pearson Chi-Square | 10.101(b) | 1 | .001 | ||
| Continuity Correction(a) | 8.348 | 1 | .004 | ||
| Likelihood Ratio | 10.492 | 1 | .001 | ||
| Fisher's Exact Test | .003 | .002 | |||
| Linear-by-Linear Association | 9.890 | 1 | .002 | ||
| N of Valid Cases | 48 | ||||
| a Computed only for a 2x2 table | |||||
| b 0 cells (.0%) have expected count less than 5. The minimum expected count is 11.50. | |||||
| Output Created | 02-OCT-2007 17:52:57 | |
|---|---|---|
| Comments | ||
| Input | Data | \\Stucluster\shared\Psychology\Ryan Lab Group\2006 - 2007\Loc_glob_live\Results\data\loc_glob_live_192_SSs_10_2_07.sav |
| Filter | pres1_abs2 = 1 (FILTER) | |
| Weight | <none> | |
| Split File | <none> | |
| N of Rows in Working Data File | 96 | |
| Missing Value Handling | Definition of Missing | User-defined missing values are treated as missing. |
| Cases Used | Statistics are based on all cases with valid data for all variables in the model. | |
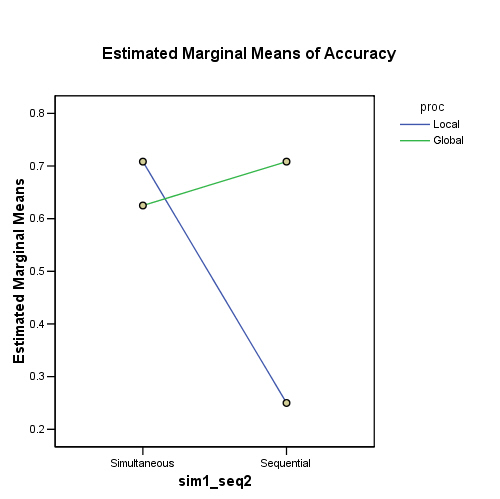
| Syntax | UNIANOVA Accuracy BY proc sim1_seq2 /METHOD = SSTYPE(3) /INTERCEPT = INCLUDE /PLOT = PROFILE( sim1_seq2*proc ) /EMMEANS = TABLES(OVERALL) /EMMEANS = TABLES(proc) /EMMEANS = TABLES(sim1_seq2) /EMMEANS = TABLES(proc*sim1_seq2) /CRITERIA = ALPHA(.05) /DESIGN = proc sim1_seq2 proc*sim1_seq2 . |
|
| Resources | Elapsed Time | 0:00:00.22 |
| Value Label | N | ||
|---|---|---|---|
| proc | 1 | Local | 48 |
| 2 | Global | 48 | |
| sim1_seq2 | 1 | Simultaneous | 48 |
| 2 | Sequential | 48 |
| Source | Type III Sum of Squares | df | Mean Square | F | Sig. |
|---|---|---|---|---|---|
| Corrected Model | 3.448(a) | 3 | 1.149 | 5.276 | .002 |
| Intercept | 31.510 | 1 | 31.510 | 144.647 | .000 |
| proc | .844 | 1 | .844 | 3.873 | .052 |
| sim1_seq2 | .844 | 1 | .844 | 3.873 | .052 |
| proc * sim1_seq2 | 1.760 | 1 | 1.760 | 8.081 | .006 |
| Error | 20.042 | 92 | .218 | ||
| Total | 55.000 | 96 | |||
| Corrected Total | 23.490 | 95 | |||
| a R Squared = .147 (Adjusted R Squared = .119) | |||||
| Mean | Std. Error | 95% Confidence Interval | |
|---|---|---|---|
| Lower Bound | Upper Bound | ||
| .573 | .048 | .478 | .668 |
| proc | Mean | Std. Error | 95% Confidence Interval | |
|---|---|---|---|---|
| Lower Bound | Upper Bound | |||
| Local | .479 | .067 | .345 | .613 |
| Global | .667 | .067 | .533 | .800 |
| sim1_seq2 | Mean | Std. Error | 95% Confidence Interval | |
|---|---|---|---|---|
| Lower Bound | Upper Bound | |||
| Simultaneous | .667 | .067 | .533 | .800 |
| Sequential | .479 | .067 | .345 | .613 |
| proc | sim1_seq2 | Mean | Std. Error | 95% Confidence Interval | |
|---|---|---|---|---|---|
| Lower Bound | Upper Bound | ||||
| Local | Simultaneous | .708 | .095 | .519 | .898 |
| Sequential | .250 | .095 | .061 | .439 | |
| Global | Simultaneous | .625 | .095 | .436 | .814 |
| Sequential | .708 | .095 | .519 | .898 | |
| Output Created | 02-OCT-2007 18:26:22 | |
|---|---|---|
| Comments | ||
| Input | Data | \\stucluster\Shared\Psychology\Ryan Lab Group\2006 - 2007\Loc_glob_live\Results\data\loc_glob_live_192_SSs_10_2_07.sav |
| Filter | <none> | |
| Weight | <none> | |
| Split File | <none> | |
| N of Rows in Working Data File | 192 | |
| Missing Value Handling | Definition of Missing | User-defined missing values are treated as missing. |
| Cases Used | Statistics are based on all cases with valid data for all variables in the model. | |
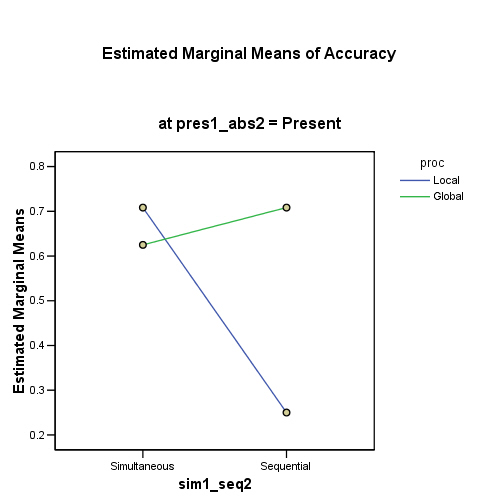
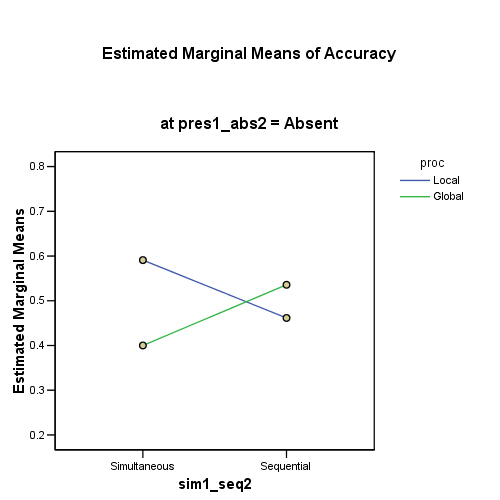
| Syntax | UNIANOVA Accuracy BY proc sim1_seq2 pres1_abs2 /METHOD = SSTYPE(3) /INTERCEPT = INCLUDE /PLOT = PROFILE( sim1_seq2*proc*pres1_abs2 ) /EMMEANS = TABLES(OVERALL) /EMMEANS = TABLES(proc) /EMMEANS = TABLES(sim1_seq2) /EMMEANS = TABLES(pres1_abs2) /EMMEANS = TABLES(proc*sim1_seq2) /EMMEANS = TABLES(proc*pres1_abs2) /EMMEANS = TABLES(sim1_seq2*pres1_abs2) /EMMEANS = TABLES(proc*sim1_seq2*pres1_abs2) /CRITERIA = ALPHA(.05) /DESIGN = proc sim1_seq2 pres1_abs2 proc*sim1_seq2 proc*pres1_abs2 sim1_seq2*pres1_abs2 proc*sim1_seq2*pres1_abs2 . |
|
| Resources | Elapsed Time | 0:00:00.13 |
| Value Label | N | ||
|---|---|---|---|
| proc | 1 | Local | 96 |
| 2 | Global | 96 | |
| sim1_seq2 | 1 | Simultaneous | 90 |
| 2 | Sequential | 102 | |
| pres1_abs2 | 1 | Present | 96 |
| 2 | Absent | 96 |
| Source | Type III Sum of Squares | df | Mean Square | F | Sig. |
|---|---|---|---|---|---|
| Corrected Model | 4.159(a) | 7 | .594 | 2.508 | .017 |
| Intercept | 54.467 | 1 | 54.467 | 229.934 | .000 |
| proc | .198 | 1 | .198 | .837 | .361 |
| sim1_seq2 | .404 | 1 | .404 | 1.706 | .193 |
| pres1_abs2 | .274 | 1 | .274 | 1.156 | .284 |
| proc * sim1_seq2 | 1.935 | 1 | 1.935 | 8.170 | .005 |
| proc * pres1_abs2 | .719 | 1 | .719 | 3.035 | .083 |
| sim1_seq2 * pres1_abs2 | .432 | 1 | .432 | 1.826 | .178 |
| proc * sim1_seq2 * pres1_abs2 | .227 | 1 | .227 | .960 | .328 |
| Error | 43.586 | 184 | .237 | ||
| Total | 103.000 | 192 | |||
| Corrected Total | 47.745 | 191 | |||
| a R Squared = .087 (Adjusted R Squared = .052) | |||||
| Mean | Std. Error | 95% Confidence Interval | |
|---|---|---|---|
| Lower Bound | Upper Bound | ||
| .535 | .035 | .465 | .605 |
| proc | Mean | Std. Error | 95% Confidence Interval | |
|---|---|---|---|---|
| Lower Bound | Upper Bound | |||
| Local | .503 | .050 | .405 | .601 |
| Global | .567 | .050 | .469 | .666 |
| sim1_seq2 | Mean | Std. Error | 95% Confidence Interval | |
|---|---|---|---|---|
| Lower Bound | Upper Bound | |||
| Simultaneous | .581 | .051 | .480 | .683 |
| Sequential | .489 | .048 | .394 | .584 |
| pres1_abs2 | Mean | Std. Error | 95% Confidence Interval | |
|---|---|---|---|---|
| Lower Bound | Upper Bound | |||
| Present | .573 | .050 | .475 | .671 |
| Absent | .497 | .050 | .398 | .596 |
| proc | sim1_seq2 | Mean | Std. Error | 95% Confidence Interval | |
|---|---|---|---|---|---|
| Lower Bound | Upper Bound | ||||
| Local | Simultaneous | .650 | .072 | .508 | .791 |
| Sequential | .356 | .069 | .220 | .492 | |
| Global | Simultaneous | .513 | .074 | .367 | .658 |
| Sequential | .622 | .068 | .488 | .756 | |
| proc | pres1_abs2 | Mean | Std. Error | 95% Confidence Interval | |
|---|---|---|---|---|---|
| Lower Bound | Upper Bound | ||||
| Local | Present | .479 | .070 | .341 | .618 |
| Absent | .526 | .070 | .387 | .665 | |
| Global | Present | .667 | .070 | .528 | .805 |
| Absent | .468 | .071 | .327 | .608 | |
| sim1_seq2 | pres1_abs2 | Mean | Std. Error | 95% Confidence Interval | |
|---|---|---|---|---|---|
| Lower Bound | Upper Bound | ||||
| Simultaneous | Present | .667 | .070 | .528 | .805 |
| Absent | .495 | .075 | .347 | .644 | |
| Sequential | Present | .479 | .070 | .341 | .618 |
| Absent | .499 | .066 | .368 | .629 | |
| proc | sim1_seq2 | pres1_abs2 | Mean | Std. Error | 95% Confidence Interval | |
|---|---|---|---|---|---|---|
| Lower Bound | Upper Bound | |||||
| Local | Simultaneous | Present | .708 | .099 | .512 | .904 |
| Absent | .591 | .104 | .386 | .796 | ||
| Sequential | Present | .250 | .099 | .054 | .446 | |
| Absent | .462 | .095 | .273 | .650 | ||
| Global | Simultaneous | Present | .625 | .099 | .429 | .821 |
| Absent | .400 | .109 | .185 | .615 | ||
| Sequential | Present | .708 | .099 | .512 | .904 | |
| Absent | .536 | .092 | .354 | .717 | ||
| Output Created | 02-OCT-2007 18:31:18 | |
|---|---|---|
| Comments | ||
| Input | Data | \\stucluster\Shared\Psychology\Ryan Lab Group\2006 - 2007\Loc_glob_live\Results\data\loc_glob_live_192_SSs_10_2_07.sav |
| Filter | pres1_abs2 = 2 (FILTER) | |
| Weight | <none> | |
| Split File | <none> | |
| N of Rows in Working Data File | 96 | |
| Missing Value Handling | Definition of Missing | User-defined missing values are treated as missing. |
| Cases Used | Statistics are based on all cases with valid data for all variables in the model. | |
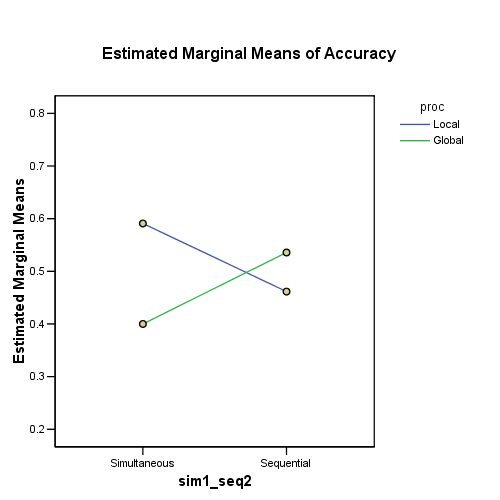
| Syntax | UNIANOVA Accuracy BY proc sim1_seq2 /METHOD = SSTYPE(3) /INTERCEPT = INCLUDE /PLOT = PROFILE( sim1_seq2*proc ) /EMMEANS = TABLES(OVERALL) /EMMEANS = TABLES(proc) /EMMEANS = TABLES(sim1_seq2) /EMMEANS = TABLES(proc*sim1_seq2) /CRITERIA = ALPHA(.05) /DESIGN = proc sim1_seq2 proc*sim1_seq2 . |
|
| Resources | Elapsed Time | 0:00:00.07 |
| Value Label | N | ||
|---|---|---|---|
| proc | 1 | Local | 48 |
| 2 | Global | 48 | |
| sim1_seq2 | 1 | Simultaneous | 42 |
| 2 | Sequential | 54 |
| Source | Type III Sum of Squares | df | Mean Square | F | Sig. |
|---|---|---|---|---|---|
| Corrected Model | .456(a) | 3 | .152 | .594 | .621 |
| Intercept | 23.302 | 1 | 23.302 | 91.056 | .000 |
| proc | .080 | 1 | .080 | .314 | .577 |
| sim1_seq2 | .000 | 1 | .000 | .001 | .976 |
| proc * sim1_seq2 | .414 | 1 | .414 | 1.619 | .206 |
| Error | 23.544 | 92 | .256 | ||
| Total | 48.000 | 96 | |||
| Corrected Total | 24.000 | 95 | |||
| a R Squared = .019 (Adjusted R Squared = -.013) | |||||
| Mean | Std. Error | 95% Confidence Interval | |
|---|---|---|---|
| Lower Bound | Upper Bound | ||
| .497 | .052 | .394 | .600 |
| proc | Mean | Std. Error | 95% Confidence Interval | |
|---|---|---|---|---|
| Lower Bound | Upper Bound | |||
| Local | .526 | .073 | .381 | .672 |
| Global | .468 | .074 | .321 | .615 |
| sim1_seq2 | Mean | Std. Error | 95% Confidence Interval | |
|---|---|---|---|---|
| Lower Bound | Upper Bound | |||
| Simultaneous | .495 | .078 | .340 | .651 |
| Sequential | .499 | .069 | .362 | .635 |
| proc | sim1_seq2 | Mean | Std. Error | 95% Confidence Interval | |
|---|---|---|---|---|---|
| Lower Bound | Upper Bound | ||||
| Local | Simultaneous | .591 | .108 | .377 | .805 |
| Sequential | .462 | .099 | .264 | .659 | |
| Global | Simultaneous | .400 | .113 | .175 | .625 |
| Sequential | .536 | .096 | .346 | .726 | |